Usage
- Set filters.
- Check Overview.
- Open Customer, Product or Impact.
- Use Details for invoice proof.
Filters
| Filter | Description |
|---|---|
| Continent / Region / Country | Geographic scope. |
| Customer | Focus on selected customers. |
| Product | Focus on selected products. |
| Date range | Period to analyse. |
Overview
Top-line KPIs, the Margin Bridge, and margin tables.
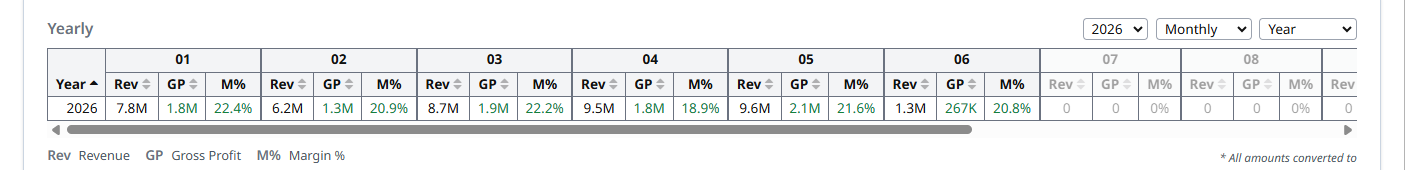
Yearly KPIs
Revenue, GP and Margin % by month.
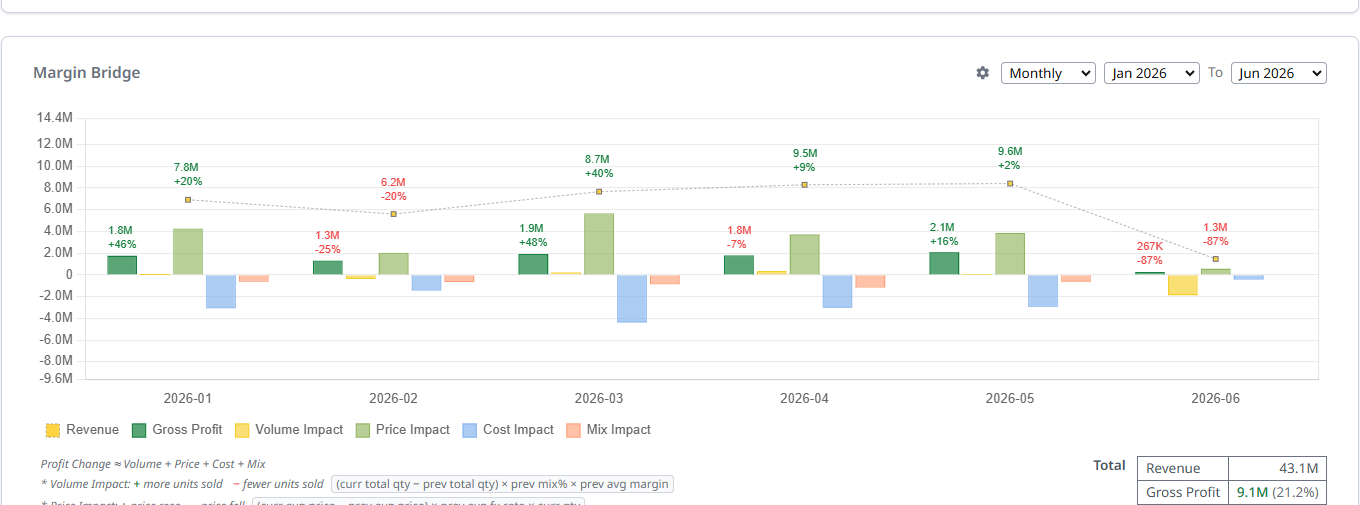
Margin Bridge
Why GP changed: Volume, Price, FX, Cost, Mix. Use P&L Impact to drill from this summary into the product × customer rows behind each driver.
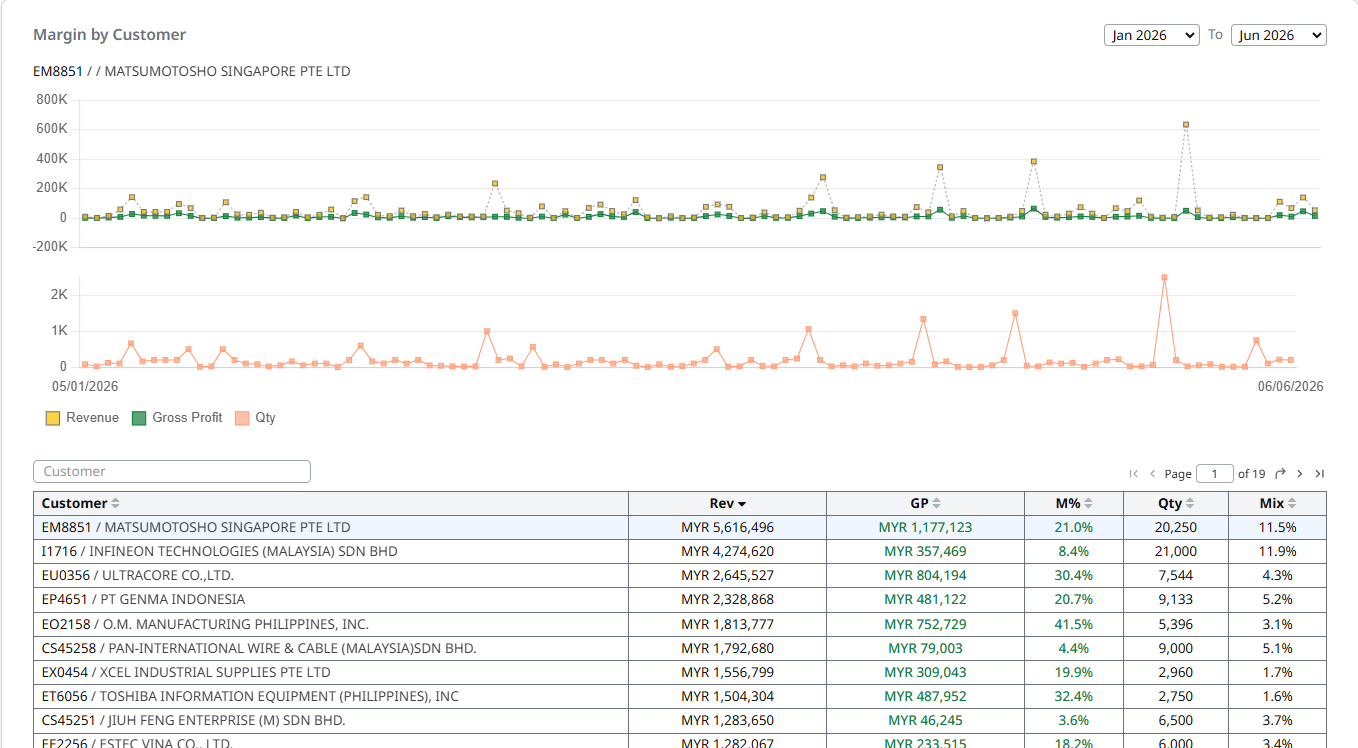
Margin by customer
Which customers created or diluted margin.
Customer
Customer revenue, GP, margin and geography.
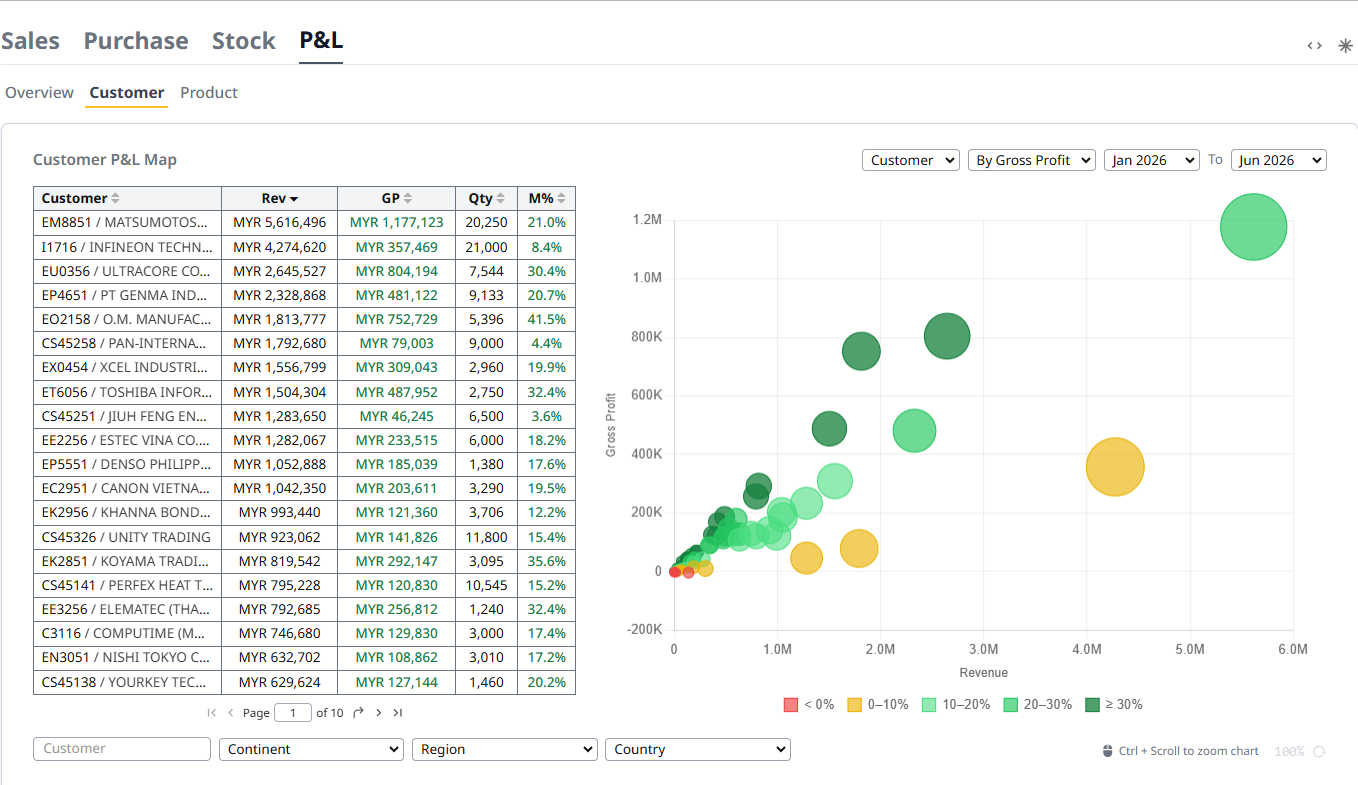
Tips
- Strong customers, weak-margin regions — large green bubbles in the upper-right are healthy; small red/yellow ones are the risks.
- Top-right of the chart is the zoom level. Use Ctrl + scroll to zoom.
- Click a bubble or table row to drill into P&L Details for that customer.
- Use the dropdown next to the date range to switch between "By Gross Profit" and "By Revenue".
Product
Product revenue, GP, margin and geography.
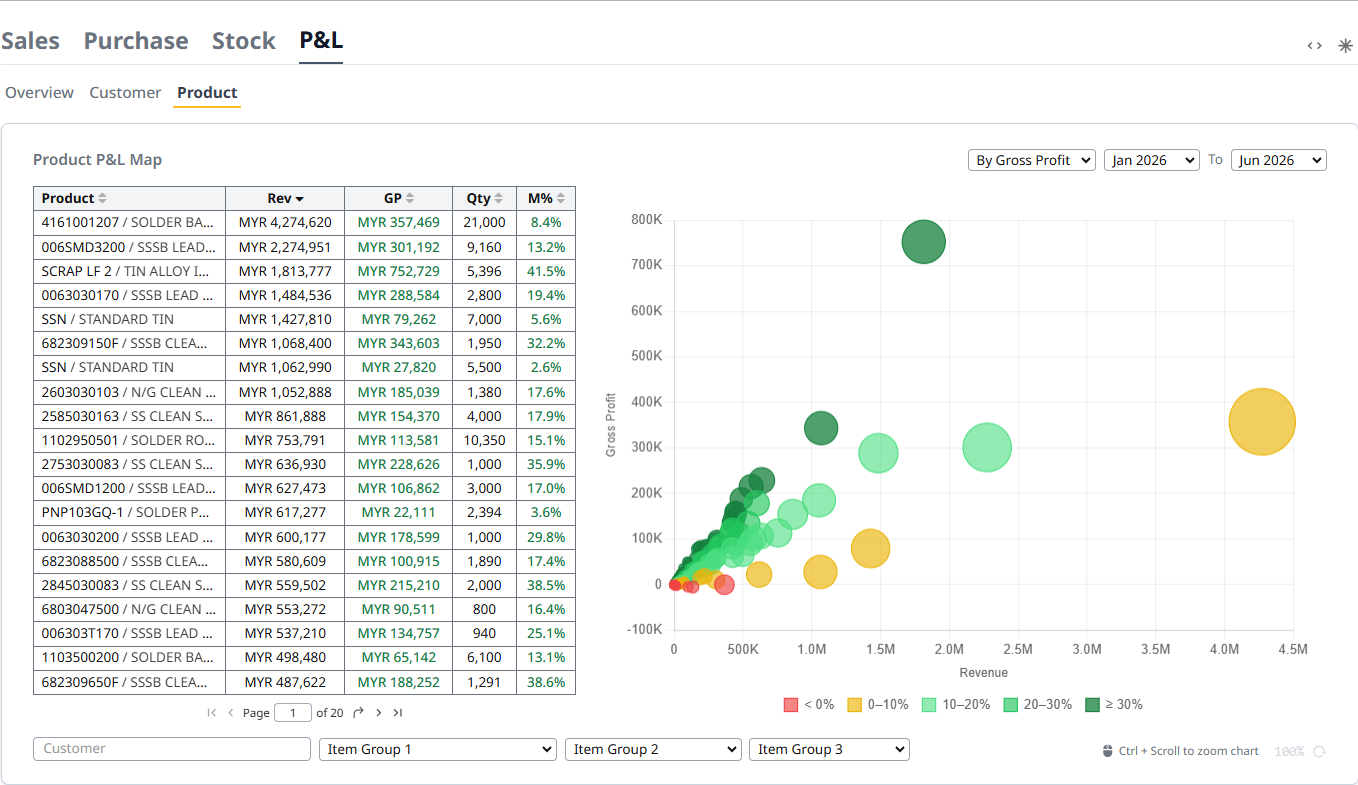
Tips
- Strongest products and weak-margin regions — the same bubble rules as Customer, applied per product.
- Click a bubble or table row to drill into P&L Details for that product.
- Use the dropdown next to the date range to switch between "By Gross Profit" and "By Revenue".
P&L Impact
Two-period attribution. Compares P1 vs P2 and splits the Gross Profit change into five drivers: Volume, Price, FX, Cost, Mix.
Filters
Two period windows (P1 and P2) at the top — defaults are: P1 = previous calendar month, P2 = current month-to-date. Plus customer, product, geography, and numeric range filters for the four impact drivers.
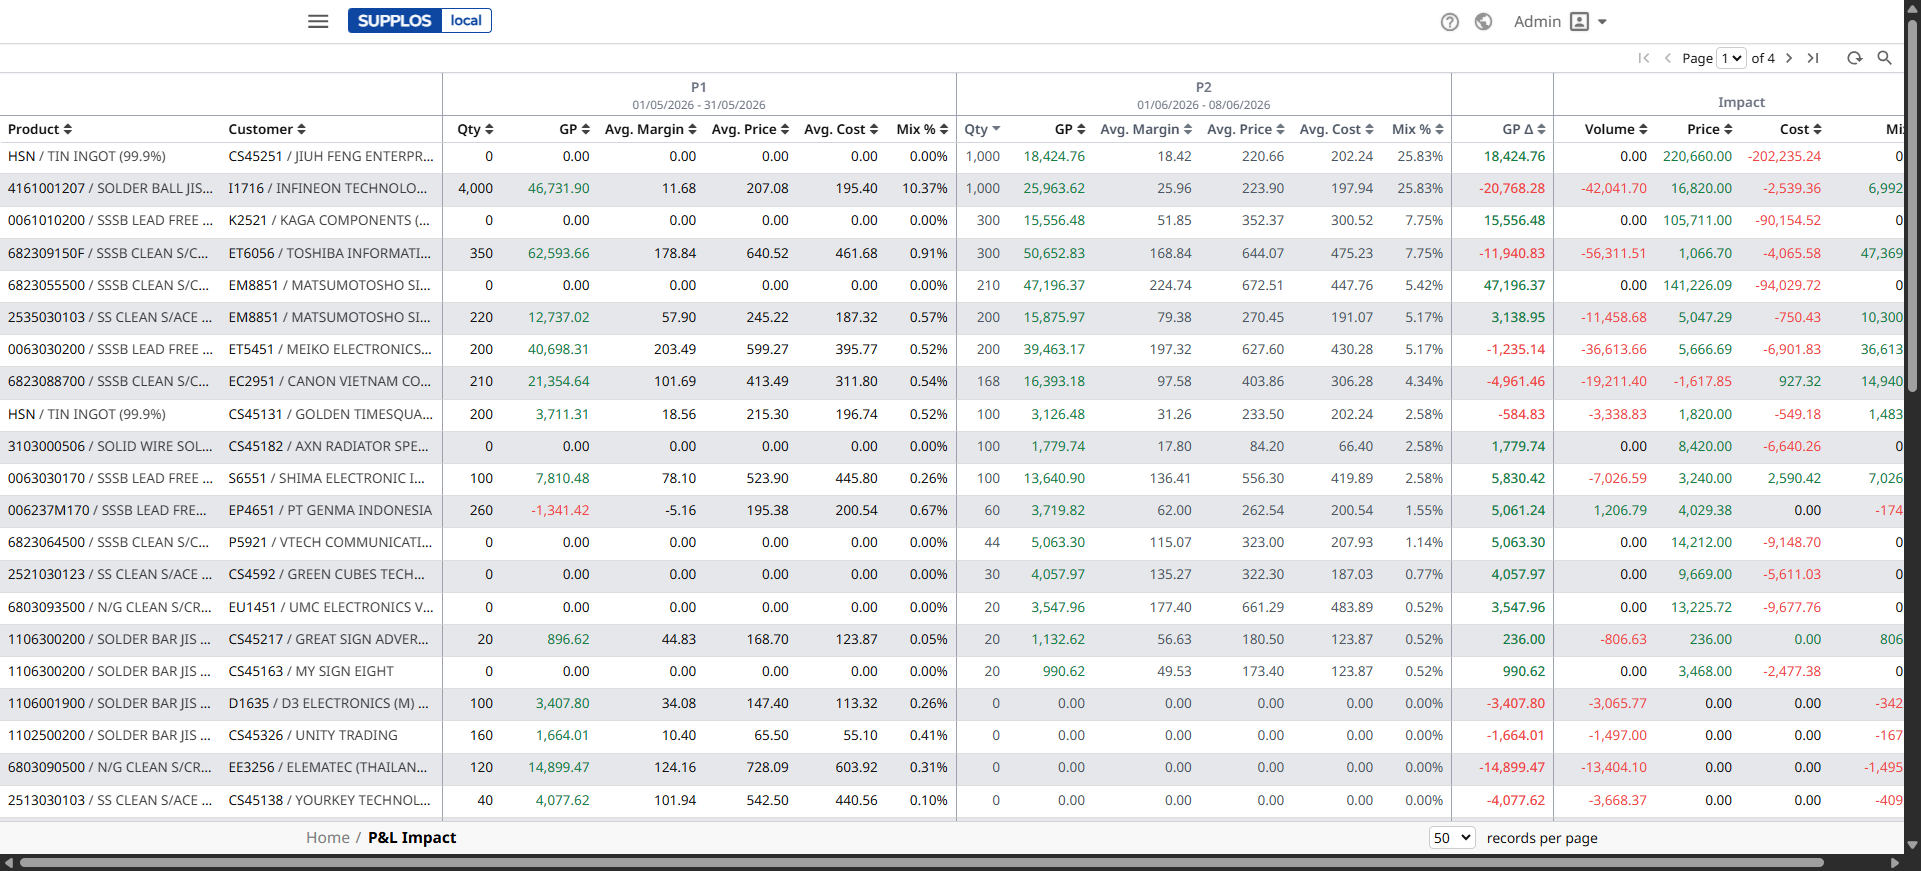
| Column group | Meaning |
|---|---|
| P1 | Base period qty, GP, margin, price, cost and mix. |
| P2 | Comparison period for the same product × customer row. |
| Impact | How much of the GP change came from volume, price, cost and mix. |
Tips
- Each row is a product × customer combination.
- The P1 block shows that period's qty, GP, avg margin / price / cost, and mix %.
- The P2 block shows the same for the second period.
- The Impact block splits the Gross-Profit change into Volume, Price, Cost, and Mix impact.
- Red = the metric dropped versus the comparison period. Green = it grew.
- Click any numeric cell to drill into P&L Details for that product × customer × period.
P&L Details
The deepest level. One row per sales-delivery line. Use it to verify the numbers behind the totals.
Filters
Date range, customer, product, geography, document number, plus numeric range filters for qty, cost, unit margin, price, margin, revenue, margin %, and mix %.
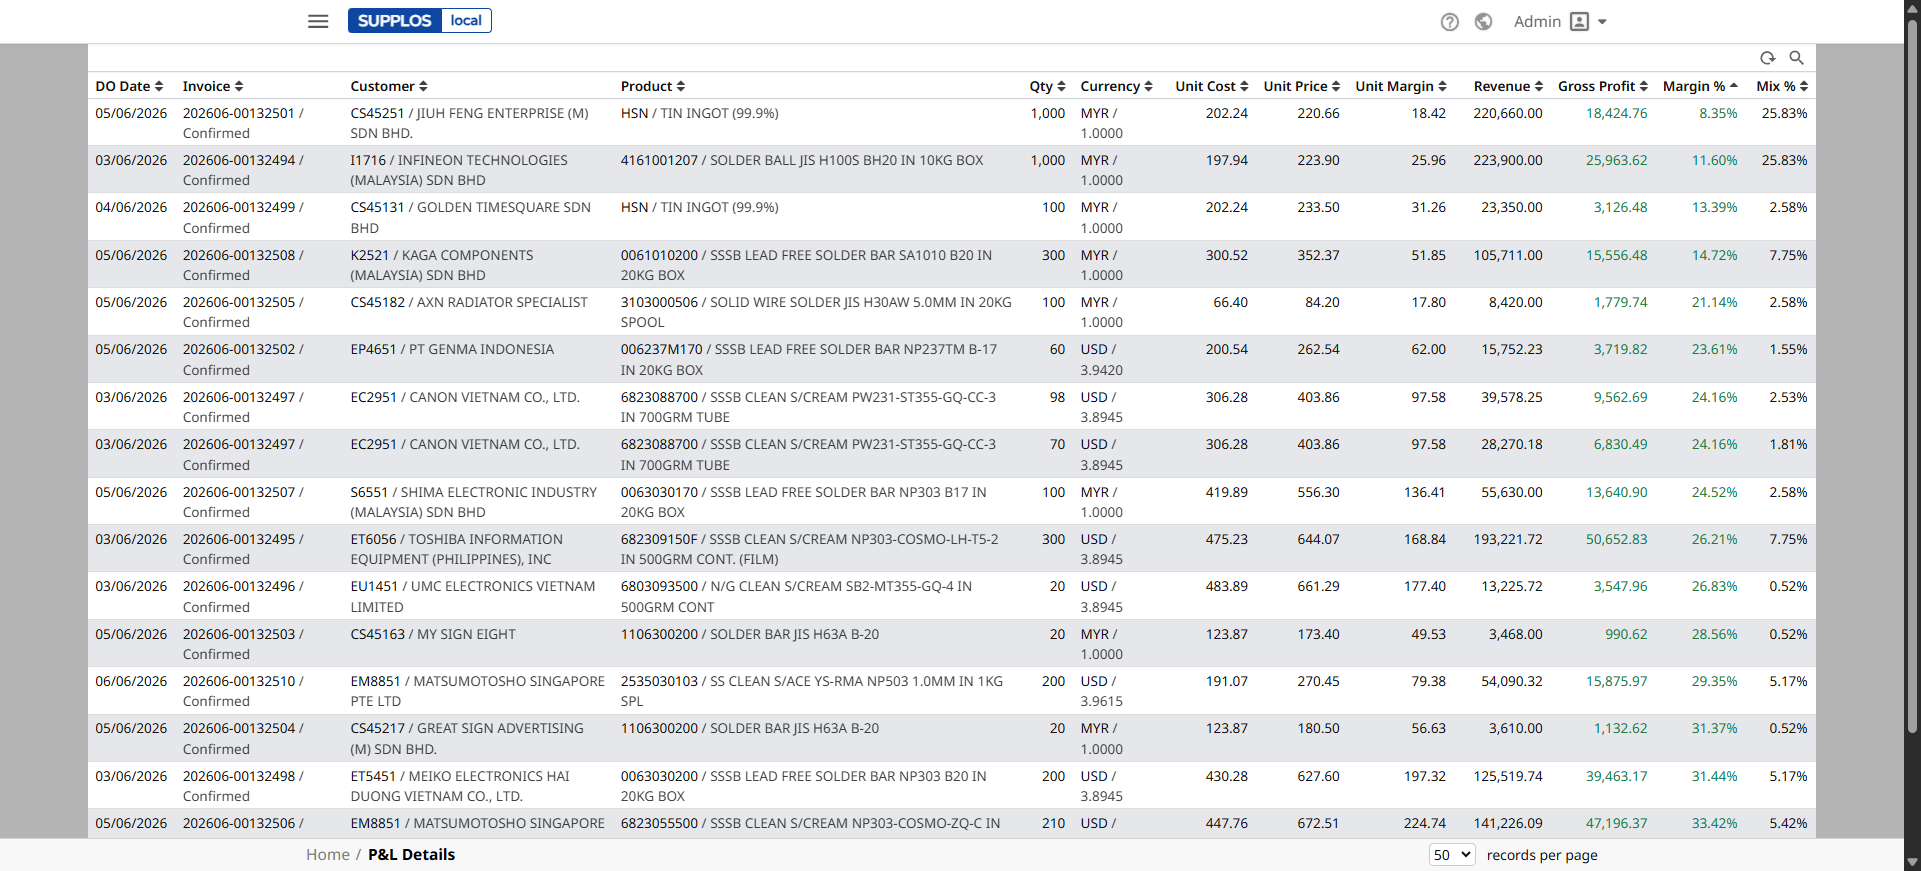
| What to check | Meaning |
|---|---|
| Invoice rows | Each line is one sales-delivery record. |
| Footer totals | Use them to confirm Total Qty, Avg Cost, Avg Price, Total GP, Margin %, and Mix %. |
| Unit Cost | Click to open the Stock Ledger for the item. |
Tips
- Click the Invoice column to open the original delivery order in a new tab.
- Click the Unit Cost cell to open the Stock Ledger for the underlying item × store.
- Click any column header to sort. Use the page size dropdown (bottom-right) to load more rows per page.