Usage
- Set filters.
- Check the KPI cards.
- Read the charts.
- Open the ranking or drilldowns.
Filters
| Filter | Description |
|---|---|
| Item Group 1 / 2 / 3 | Cascading dropdowns. Pick the most detailed group. |
| From month | Start month. |
| To month | End month. |
| Quantity / Amount | Switch charts between counts and currency. |
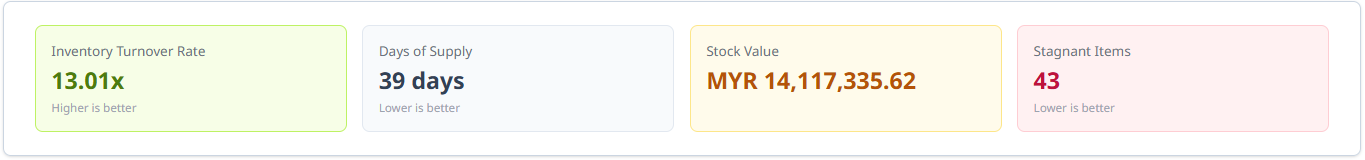
KPI Cards
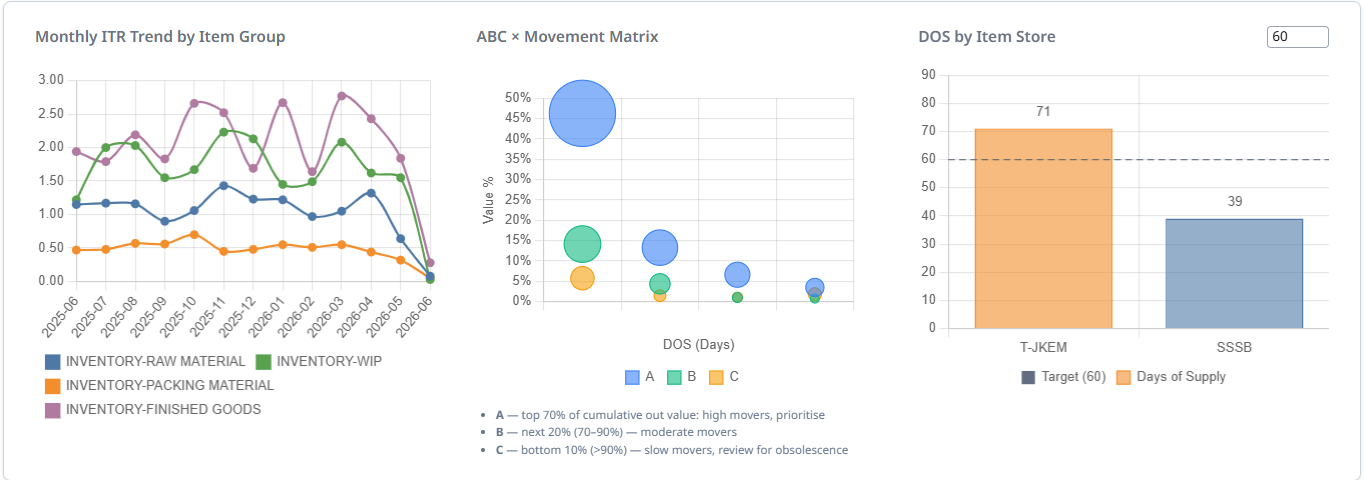
Top-Row Charts
Bottom-Row Charts
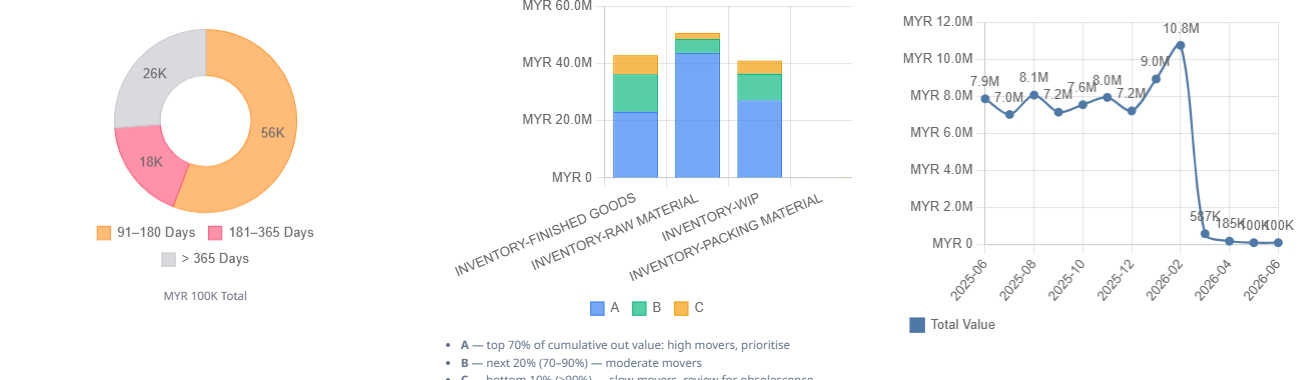
| Chart | Description |
|---|---|
| Stagnation Age Bands | Older bands = higher write-down risk. |
| ABC Value by Item Group | Largest A-value groups need the most control. |
| Stagnant Inventory Value Trend | Rising line = stale stock is growing. |
Stagnant Inventory Ranking
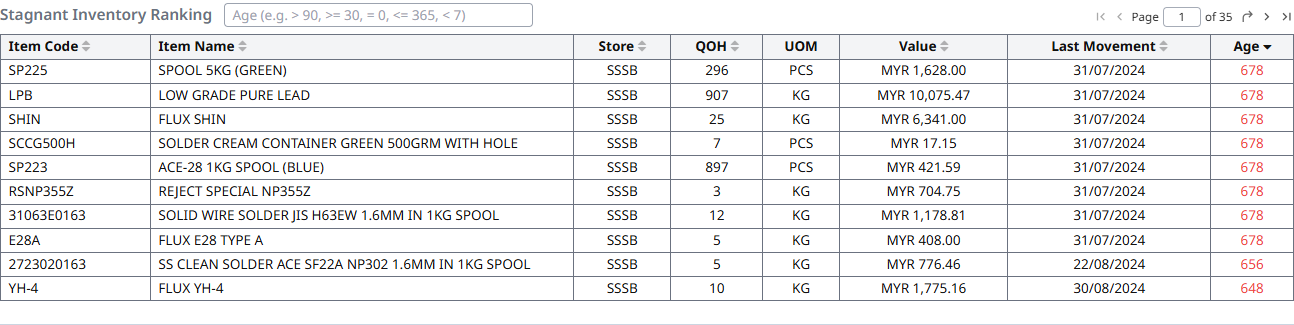
Tips
- First items to check for stale stock.
- Sort by value or age.
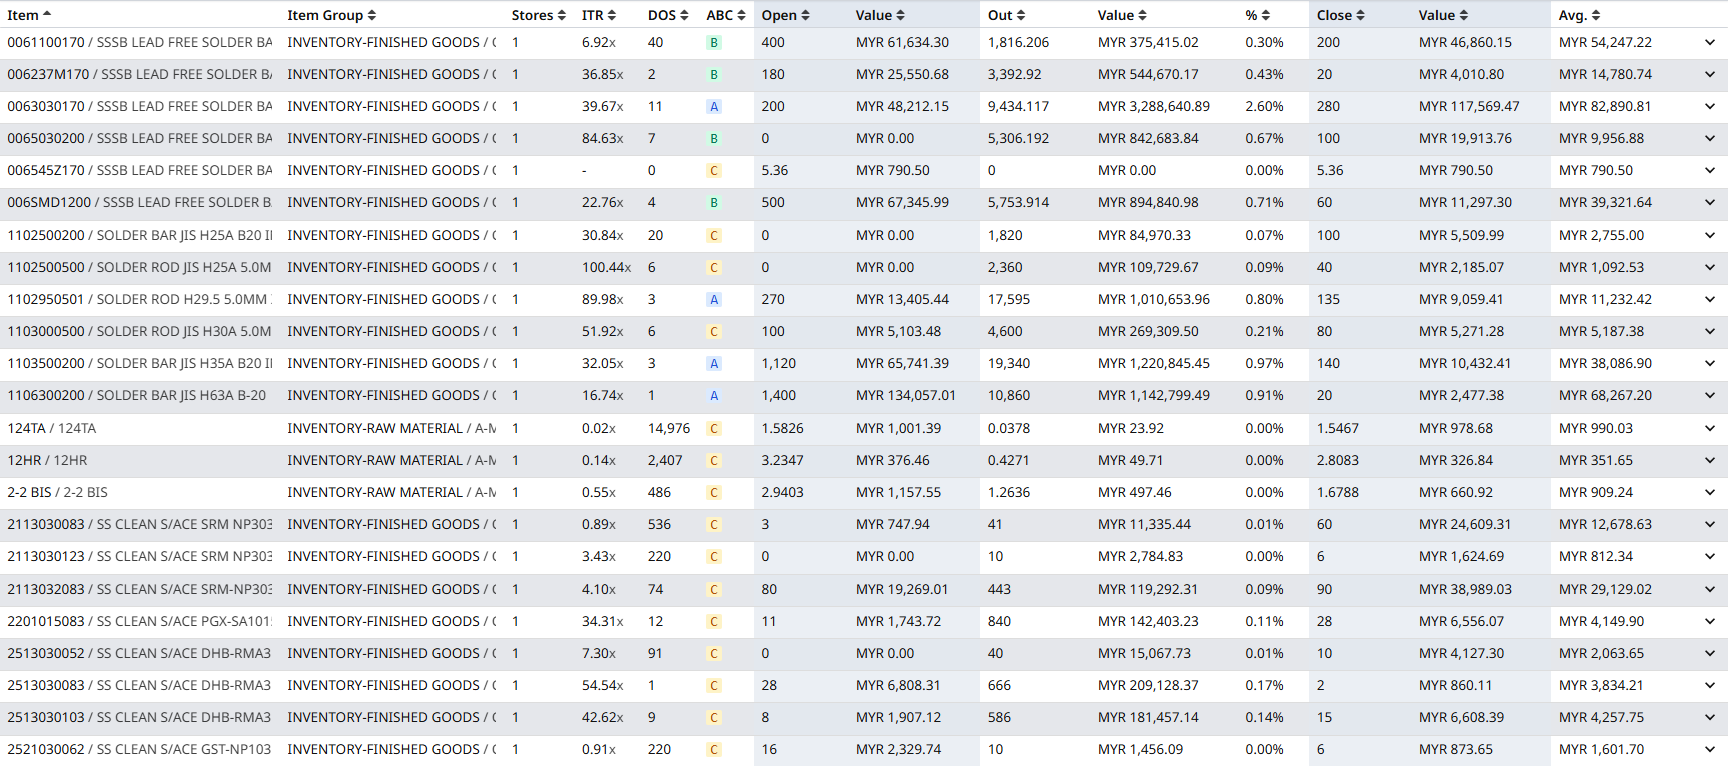
Drilldown → Detail 1
A pivot table of every item in your current filter, with the full set of stock metrics. Use this when you want to compare items side by side and see who needs attention.
Filters
Date range, item code or name, item groups, store, plus numeric range filters for DOS, ITR, ABC class, opening / closing / out quantities and values, value %, and average stock value. Type >10 or =5.5 to use the range filter.
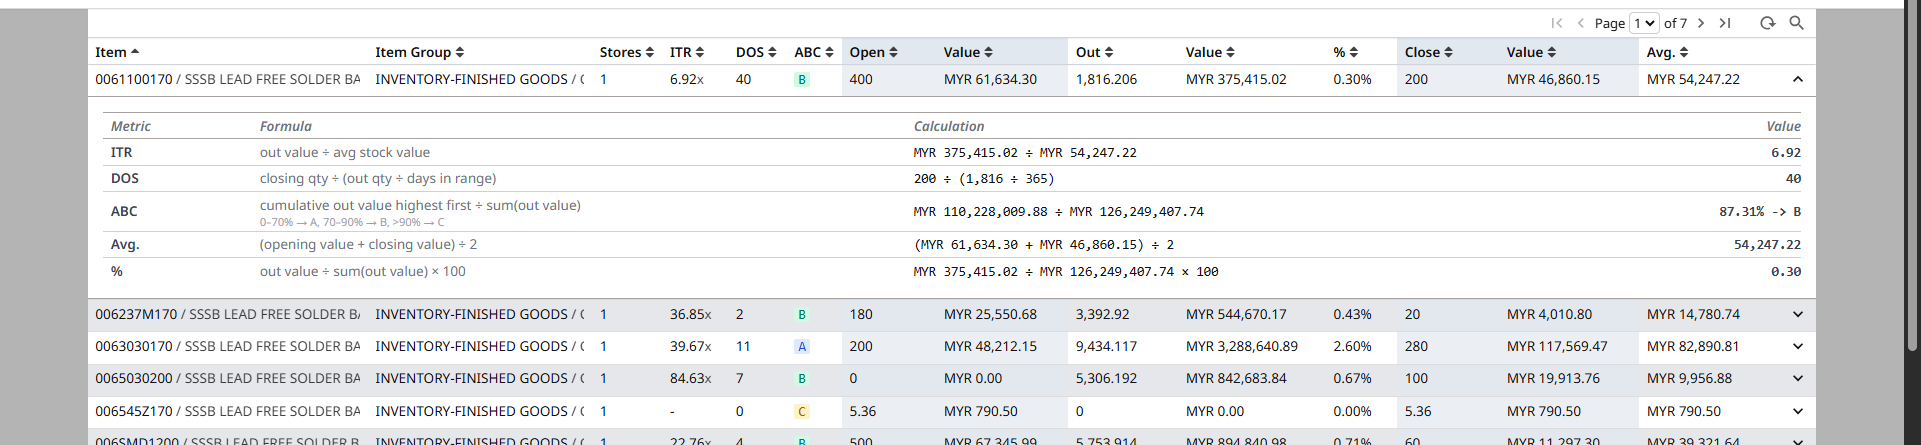
Expand a row to see the metric breakdown
Click the ˅ chevron at the right end of a row to expand it. The panel shows the Metric, Formula, Calculation, and computed Value for ITR, DOS, ABC class, Avg. stock value, and Value %.
Tips
- Click any column header to sort (ascending / descending).
- Click the ˅ chevron at the right end of a row to expand the metric breakdown.
- Click a row to drill into Detail 2 for the same item across all stores.
- Click an ABC class value to filter the whole list to that class.
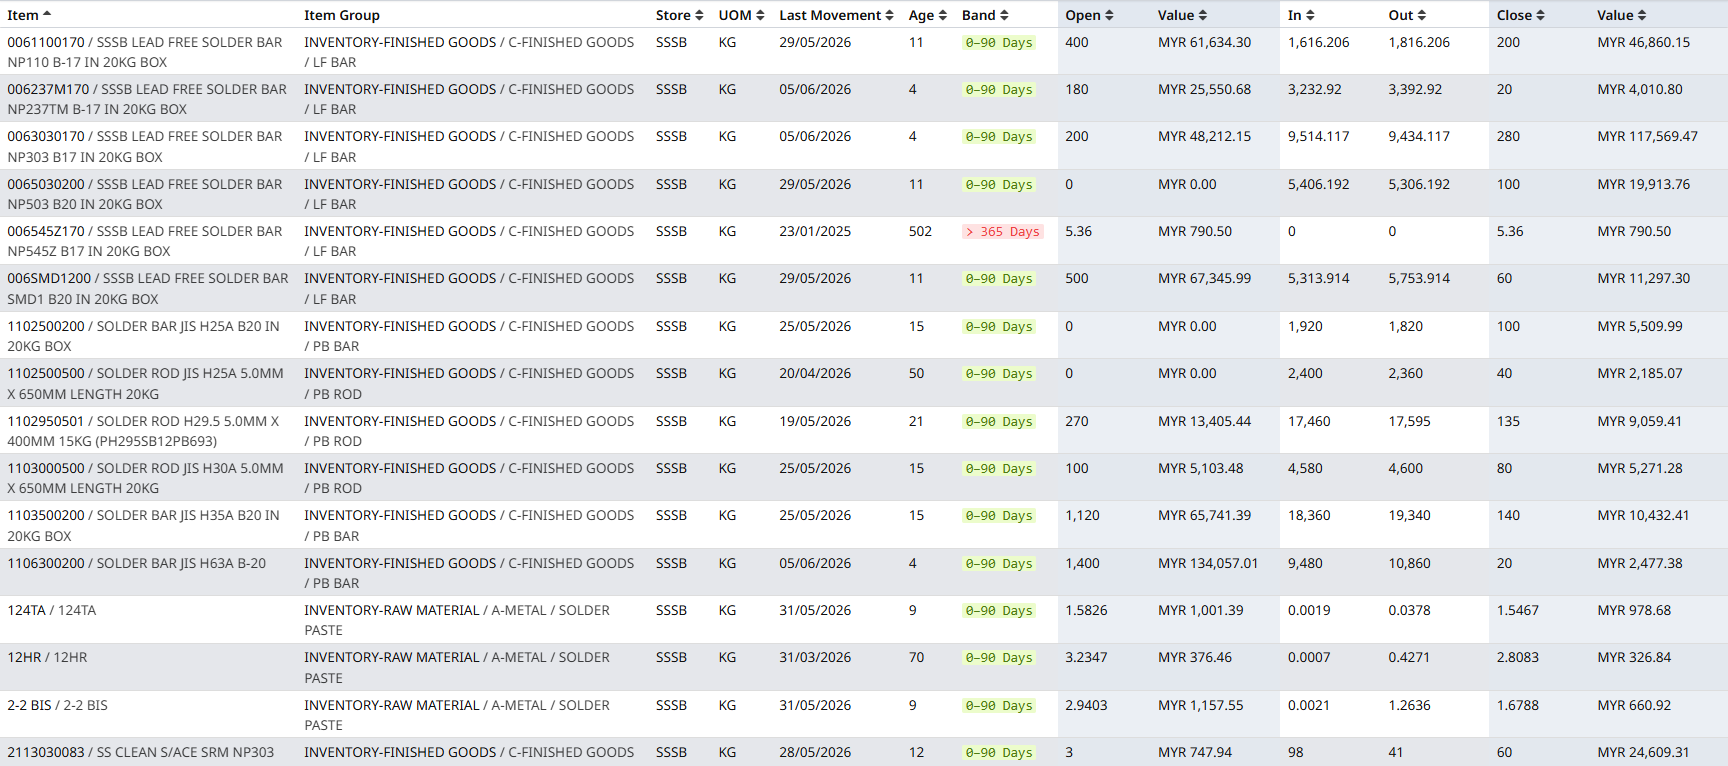
Drilldown → Detail 2
A per-item × per-store view. Same data as Detail 1, but split by store, with the age band for each row so you can scan the stale stock instantly.
Filters
Same as Detail 1, plus per-store filters for age, opening, in, out, closing quantities and values.
Tips
- The Age band column is colour-coded — green = fresh, orange = stagnant, red = obsolete risk.
- Click any cell to drill into the Stock Ledger for that item × store.
- Click a column header to sort.
Drilldown → Stock Ledger
The deepest level. A per-item summary (one row per item with its total QOH), and a per-item transaction log you can expand to see how the stock moved over time.
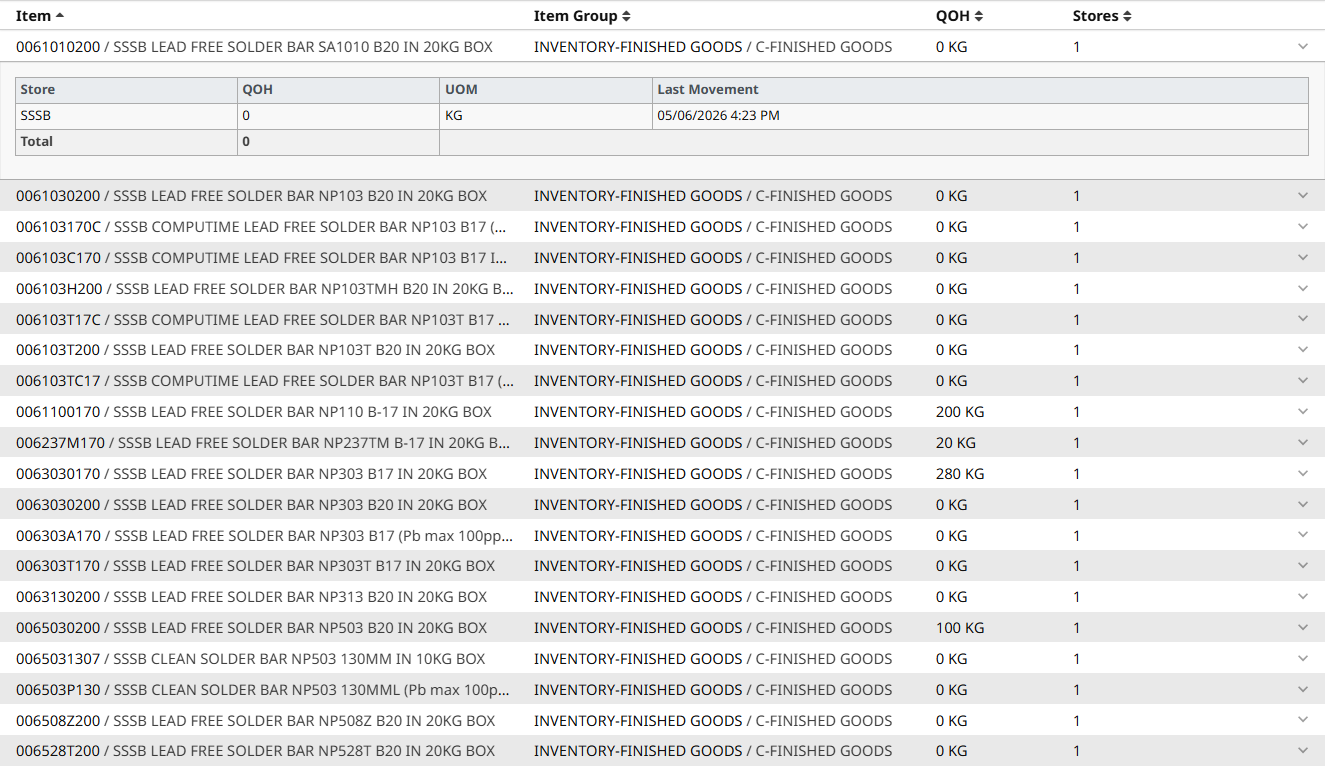
Stock Ledger Index
Lists every item with a quick-glance view of its current QOH and which stores it lives in. Use the search box to find an item by name, code, barcode, lot number, document number, etc.
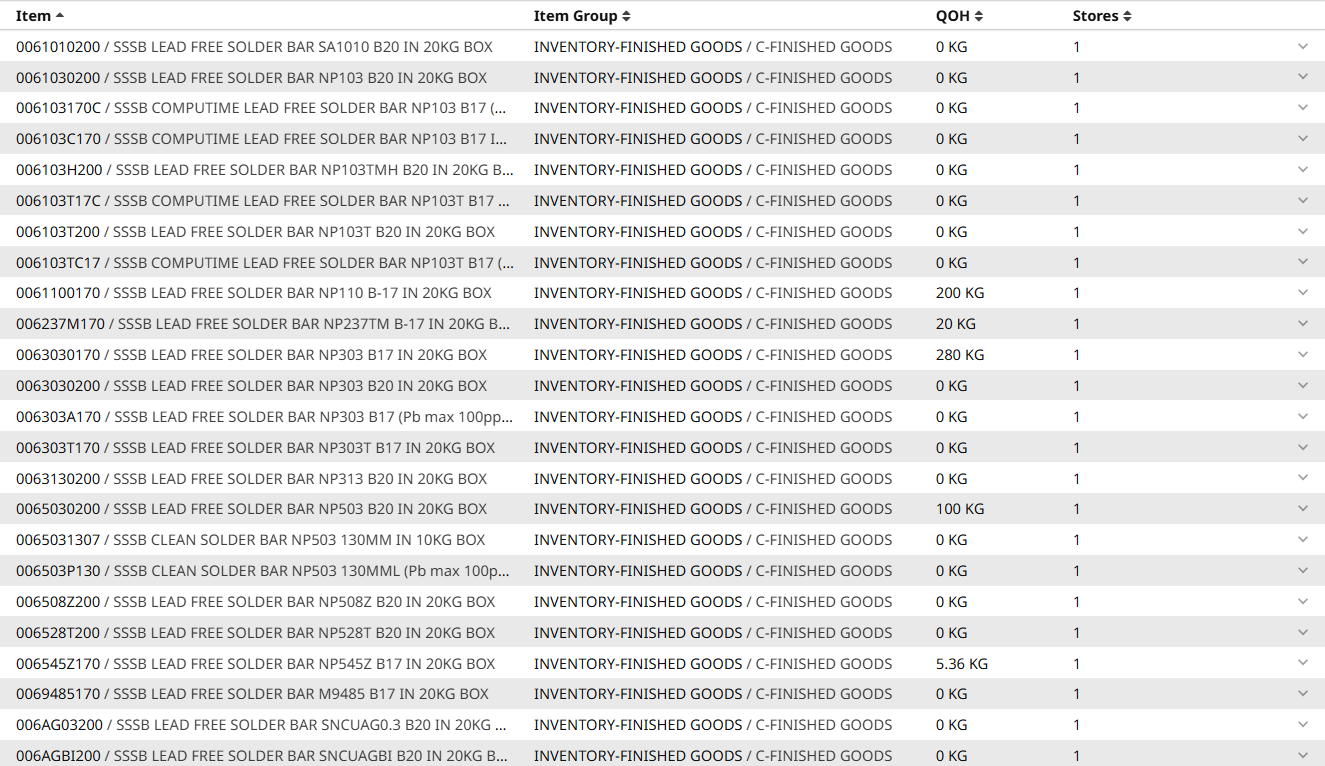
Expand a row to see the per-store breakdown
Click the chevron at the right end of a row to expand it. The panel shows QOH, UOM, and last movement for each store the item lives in.
To see the full transaction log for an item
Open the item's master page (click the item name) and use the Stock Ledger view there, or apply date and store filters from the top of the Stock Ledger index page to narrow down the list to a single item × store.